Seaborn is a visualization library that has much better defaults than matplotlib. Basically it’s a tool for data scientists to create awesome visualizations without being a visualization expert. To play with this new library, I used a nice open dataset from GoodReads that I found on Kaggle.
I had a couple issues: Some random rows had extra columns, which I fixed by using the ‘error_bad_lines’ method. Also, one of the columns had a pound sign, which indicates a comment in python so I created a new dataframe with a renamed version of that column. Here’s the first 5 rows of data:
BookID is NOT just 1 + index, The longest book is 6,576 pages long., The average average rating is 3.9, the mean number of reviews is 13 times higher than the median. Now, onto the pictures!
Visualizing Univariate (Single Variable) Data
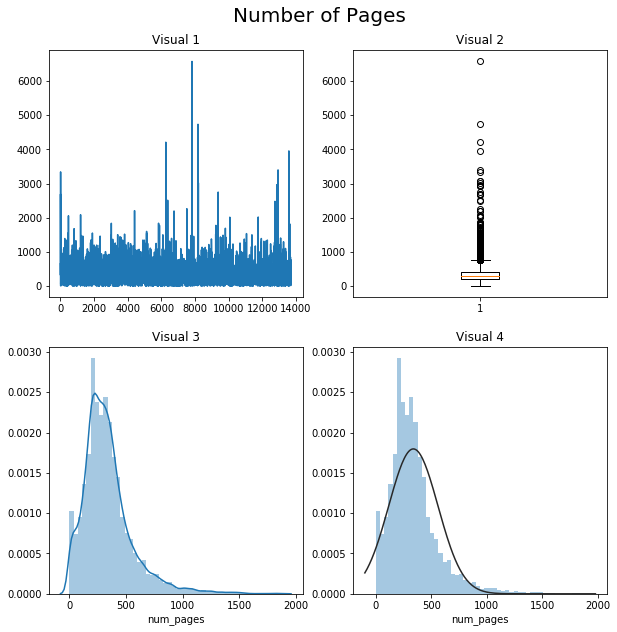
#1: Most basic line graph. The size/type of data means this is basically meaningless
#2: Boxplot gives us a better idea of the median data point and outliers, but is ugly.
#3: Histogram describes shape of the data the best, and I included a KDE.
#4: Histogram with a best-guess normal distribution. This data doesn’t seem to be ‘normal.’
Visualizing Average Ratings and Ratings Count
Hard to tell how clumped the data is, and kind of boring to look at.
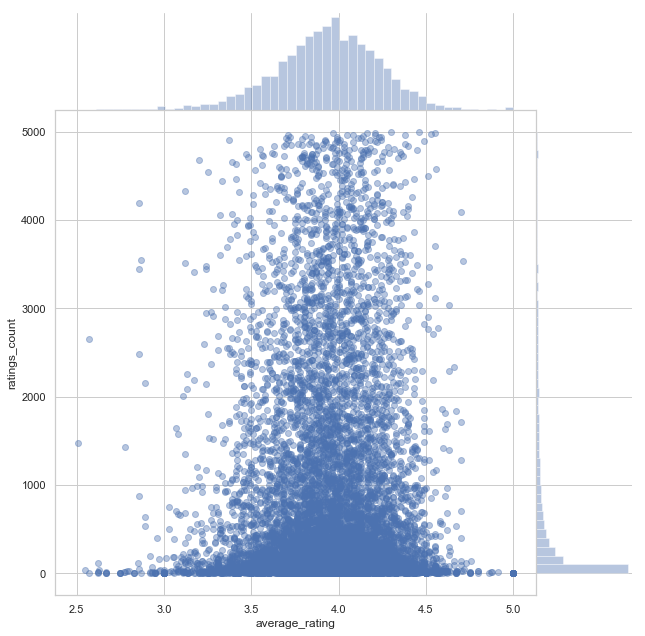
By zooming and setting the alpha, we already have a more interesting and informative visualization.
Green!
Love this graph from Seaborn. We get individual distributions of the two variables as well as the relationship between them.
Visualizing Language and Number of Pages
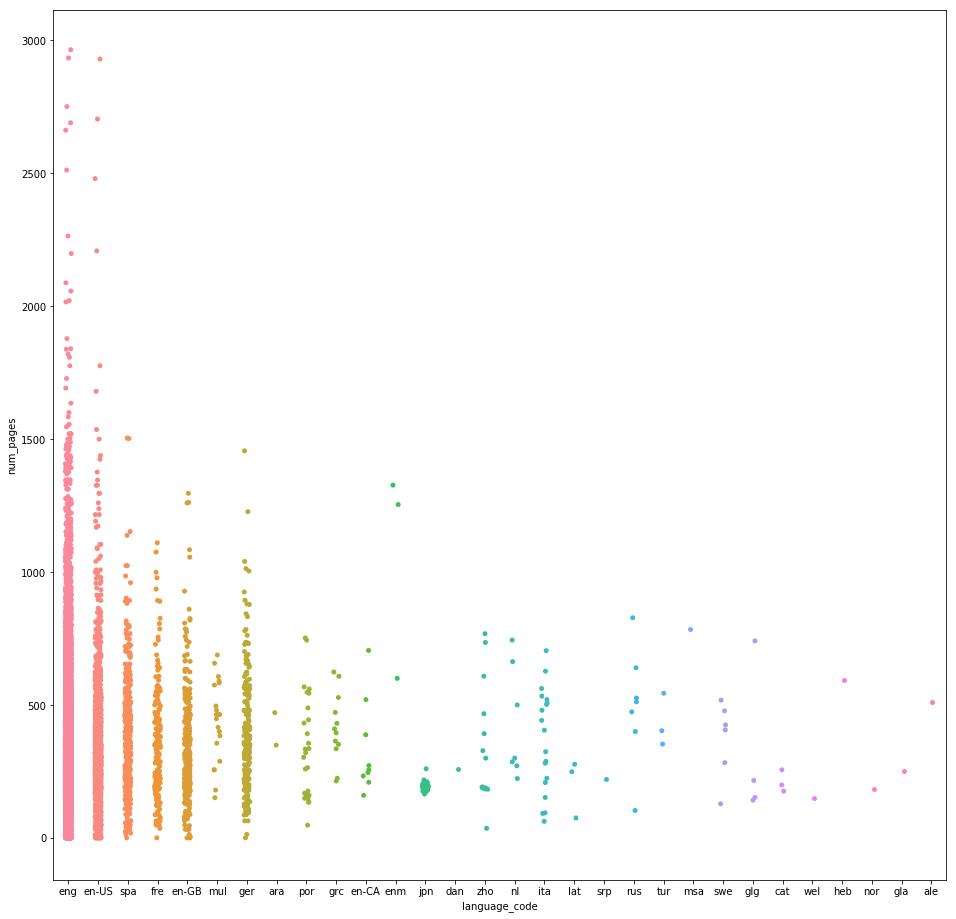
Looks adorable, but a little too sparse to understand what’s going on.I wanted violins around the data but there’s just too many categories!
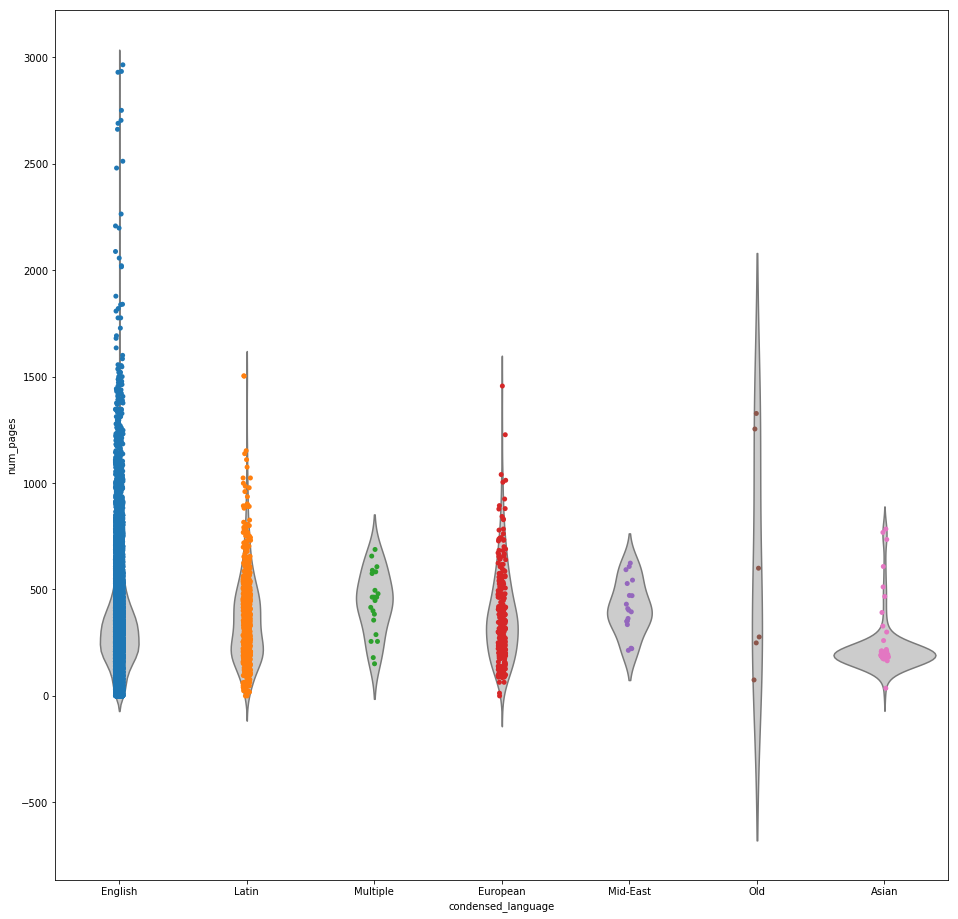
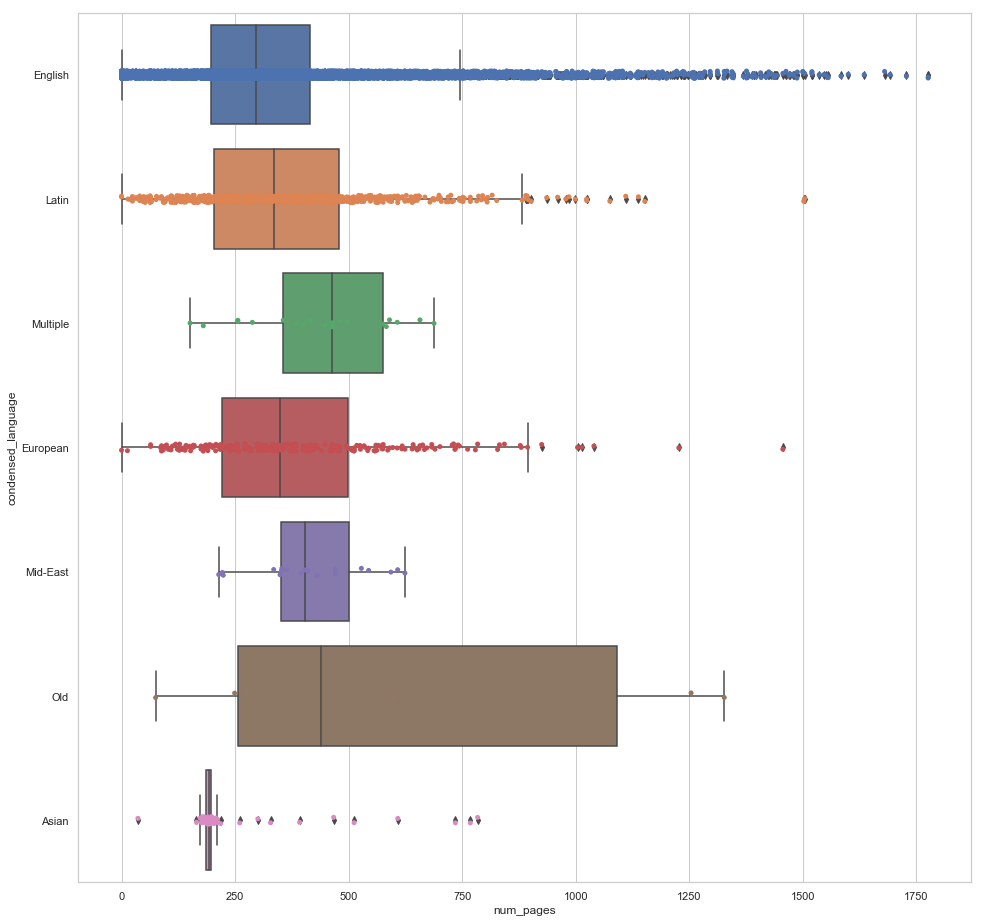
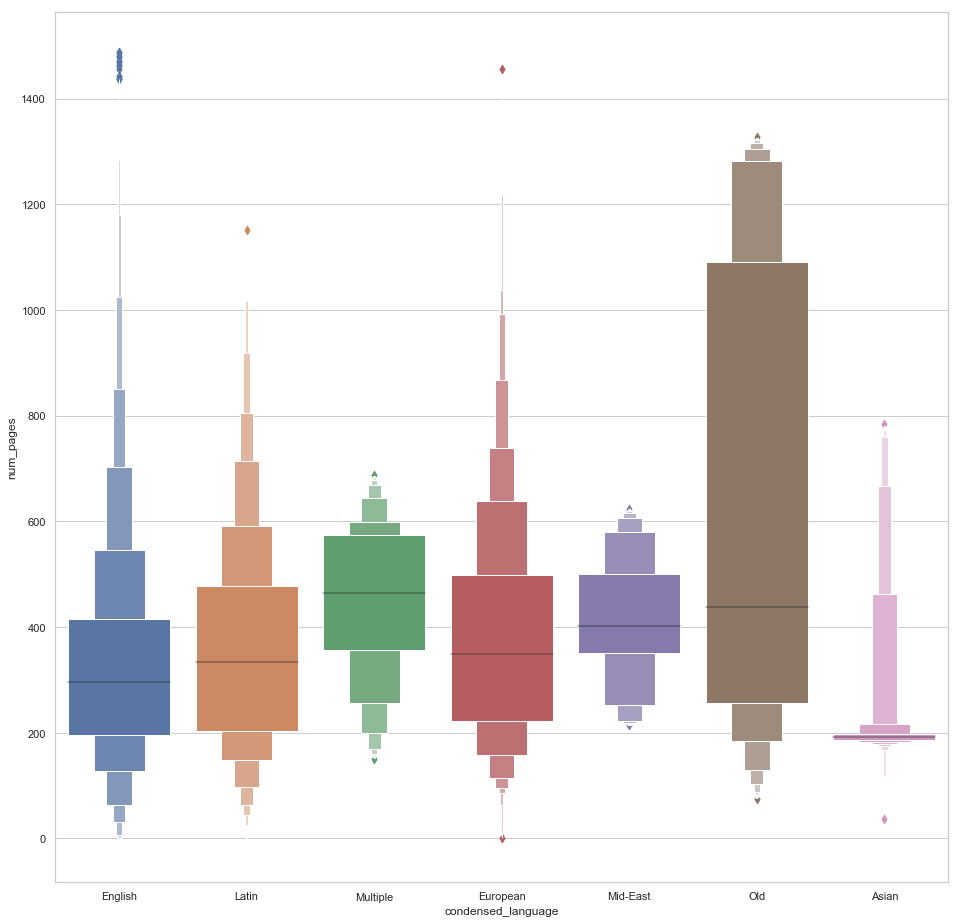
I wanted to visualize the differences between languages better, and so I decided to artificially group them into 7 categories. Linguistics is not my specialty, but I am proud that I grouped Galician into European and Catalan into Latin. Note that Latin itself was grouped into ‘Old’ and not Latin. Also, I took some liberties in the ‘Asian’ and ‘Mid-East’ categories.
After condensing, I finally get what I want and we get to see a nice picture of the distributions for each category.This picture is much more informative. We also get information about the centers of each category.Little too much going on here. Not sure the violins are adding anything except clutter.I really like this visualization. The only issue is it doesn’t indicate the quantity of data points in each category.
Visualizing the Entire Dataset
The distributions of each variable are clearly displayed on the diagonal of this visualization. Average rating looks normal-ish. Number of pages is skewed the right, and the number of ratings and text reviews both start high and seem to drop off exponentially. I can tell that number of pages is not correlated very strongly with average rating, whereas the number of ratings and text reviews do appear to be correlated with average rating. Rating count and text reviews have a pretty clear positive correlation. If I estimate a regression line for the number of ratings and the number of text reviews, it seems like not US English books have more reviews per rating than English books. This implies that non-English speakers are more motivated to write a review as opposed to simply just click a rating.
I like Seaborn a lot! The strength of the library is in it’s default visualization power. It is possible to do all of this in MatPlotLib but it would be much more tedious and require more expertise. I expect to be using Seaborn a lot as I move into more complex data science and require more complicated visuals.