I set out to use AirBnB data in San Francisco and my SQL training to answer questions about the city to help travelers interested in visiting.
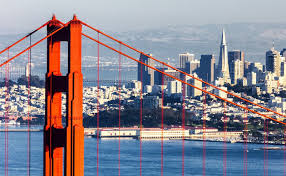
What neighborhoods seem to be the most popular?
What’s the most expensive listing? Anything interesting about it?
What time of year is the cheapest to go to San Francisco? What about the busiest?
First, I wanted to explore AirBnB’s free data, which is stored in 21 tables. For simplicity I only selected the first 5 rows of each table to get a peek. For the ‘listings’ table I only selected the first 9 columns as well since there was too many to fit comfortably in this blog. Each table is captioned with the SQL code used to generate it.


I wanted to figure out the number of rows for each table and display them in one SQL query.

ERROR. Hmm….SQL does not work like intuitively like python. Honestly, SQL’s logic feels more like conversation than code.

Got it! As I feared: The three tables have dramatically different sizes. Listings is a table of every listing in SF, reviews are all of the reviews written, and calendar appears to be every day of the year for each listing. Let’s check: 2383085 /6633 = 359, which is almost 365 implying that this is every day of the year for each listing and there’s a bit of missing data.
OK, now that I have explored my tables a bit and gotten my bearings with the data, I am ready to start answering my questions.
What Neighborhoods Seem to be the Most Popular?
First, I need to define the parameters of my question so I can answer it in a meaningful way. What is a neighborhood?

Lucky for us, this is clearly defined in one of our tables. These are the first 10 of 36 neighborhoods.

The other parameter I need to define is ‘popular.’ One definition would be the number of listings in the neighborhood, but I since they differ greatly in population and size, this wouldn’t be the best measure. Instead I went with the percent of listings that are occupied at any given day in the data set.

I combined the calendar table with the listings so I could get the neighborhood column next to the available column. Now I have every day of the year for every listing and if it was ‘f’ (vacant) or ‘t’ (taken).

import pandas as pd
data = pd.read_csv(‘#LOCAL FILE OMITTED#’)
ratio_array = []
for i in range(36):
if data[‘vacant’][i*2] == ‘f’:
ratio_array.append((data[‘total’][2 * i + 1])/(data[‘total’][2 * i + 1] + data[‘total’][2 * i]))
else:
ratio_array.append((data[‘total’][2 * i])/(data[‘total’][2 * i + 1] + data[‘total’][2 * i]))
ratio_dict = {}
for i in range(36):
ratio_dict[data[‘neighbourhood’][i * 2]] = ratio_array[i]
sorted_ratio_array = sorted(ratio_array)
for i in ratio_dict:
if ratio_dict[i] == sorted_ratio_array[-1]:
print(‘Highest rate of occupied listings: ‘ + i)
elif ratio_dict[i] == sorted_ratio_array[-2]:
print(‘Second highest rate of occupied listings: ‘ + i)
Second highest rate of occupied listings: Lakeshore
Highest rate of occupied listings: Presidio
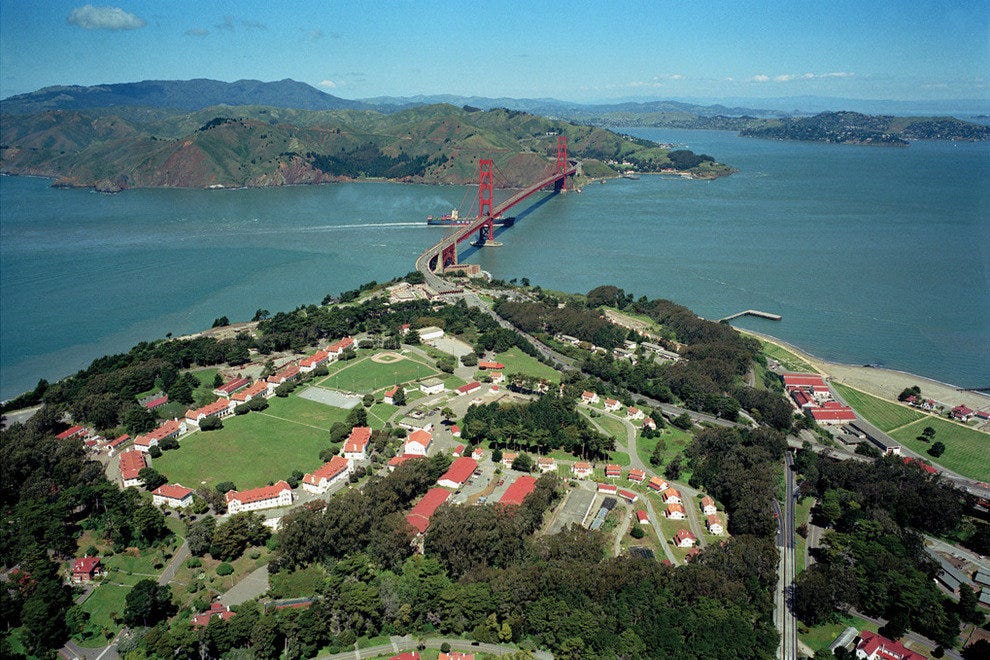
Got lazy trying to figure out how to do this in SQL so I just did some quick python code. As it turned out, the highest rate of occupied listings is the Presidio, pictured to the left. Although people do live in the Presidio, it is mostly a park and only has 1 listing, and so we don’t have enough data to call it the most popular neighborhood. Lakeshore is also mostly a park in #2 although there is more data.
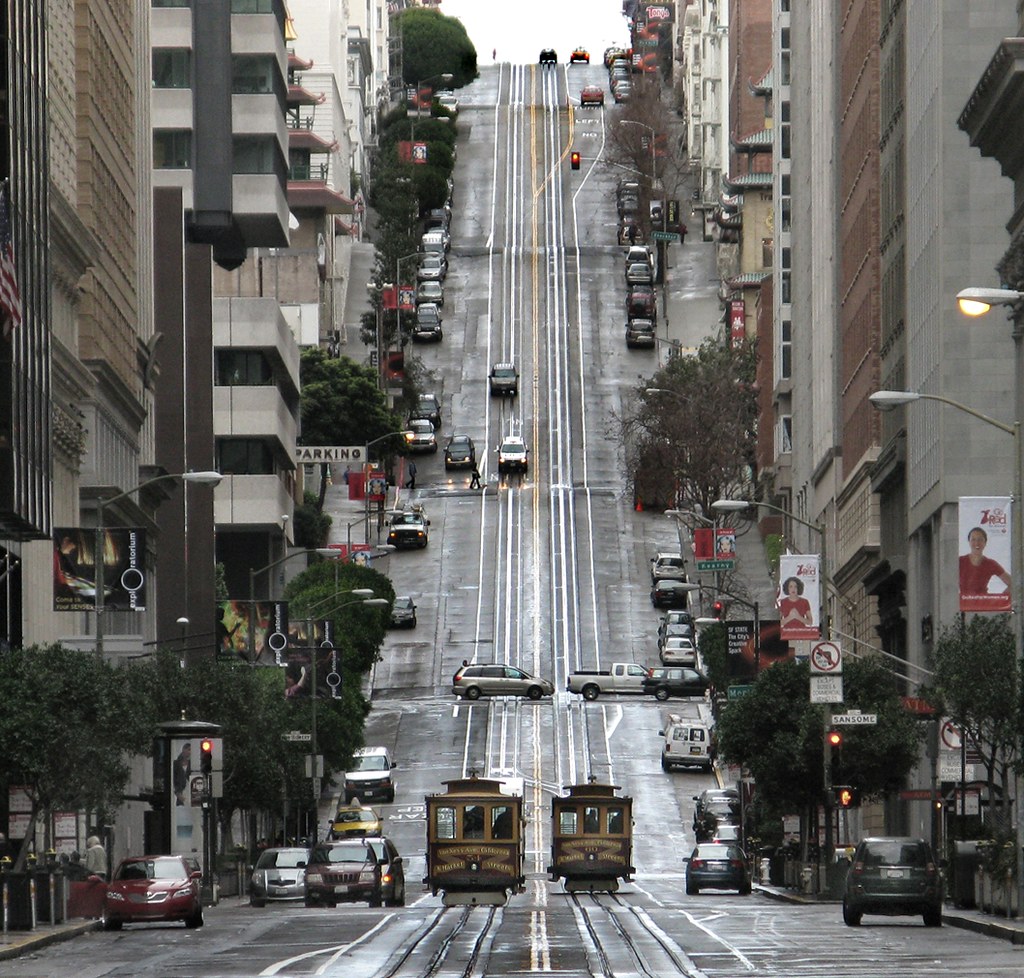
The neighborhood that’s actually a neighborhood and has the highest percentage of occupied listings with sufficient data is Nob Hill. This is one of the oldest neighborhoods in San Francisco and also one of the most high class. A fantastic place to visit and stay, and the data supports it as the most popular.
What’s the Most Expensive Listing?
Very easy to find with a simple query. A full house 7,500 sq ft Victorian, owned by Sarah in the Western Addition neighborhood. It’s only available 18 days out of the year, and it goes for 10,000 per night. I was able to find 4 reviews for it:
Gorgeous home, Terrific hosts. Was amazing place for our crew to return to and work/relax after long days
– Dave
My friends and I travelled to San Francisco for a wedding. Everyone agreed the home was beautiful and spacious. The hosts, Sarah and Jason, were also super pleasant to deal with. Overall, would 100% recommend this home to anyone looking for a place to stay in San Francisco.
– David
The house was perfect for the 7 adults and 1 infant we had with us. The location was great, kitchen was amazing, and the family loved the projector viewing for movies and basketball. We would definitely rent again.
– Kim
Sarah’s home is beautiful! It is comfy, clean, spacious, and in a great neighborhood. We will certainly be back!
– Aggie
What time of year is the cheapest to go to San Francisco? What about the busiest?
I want to rephrase this question slightly so it’s more applicable to the lives of cheap people (like myself.) ‘What time of year is it easiest to get a cheap listing?’

